Sentira™ Emotion Intelligence Platform · Beta Access Open
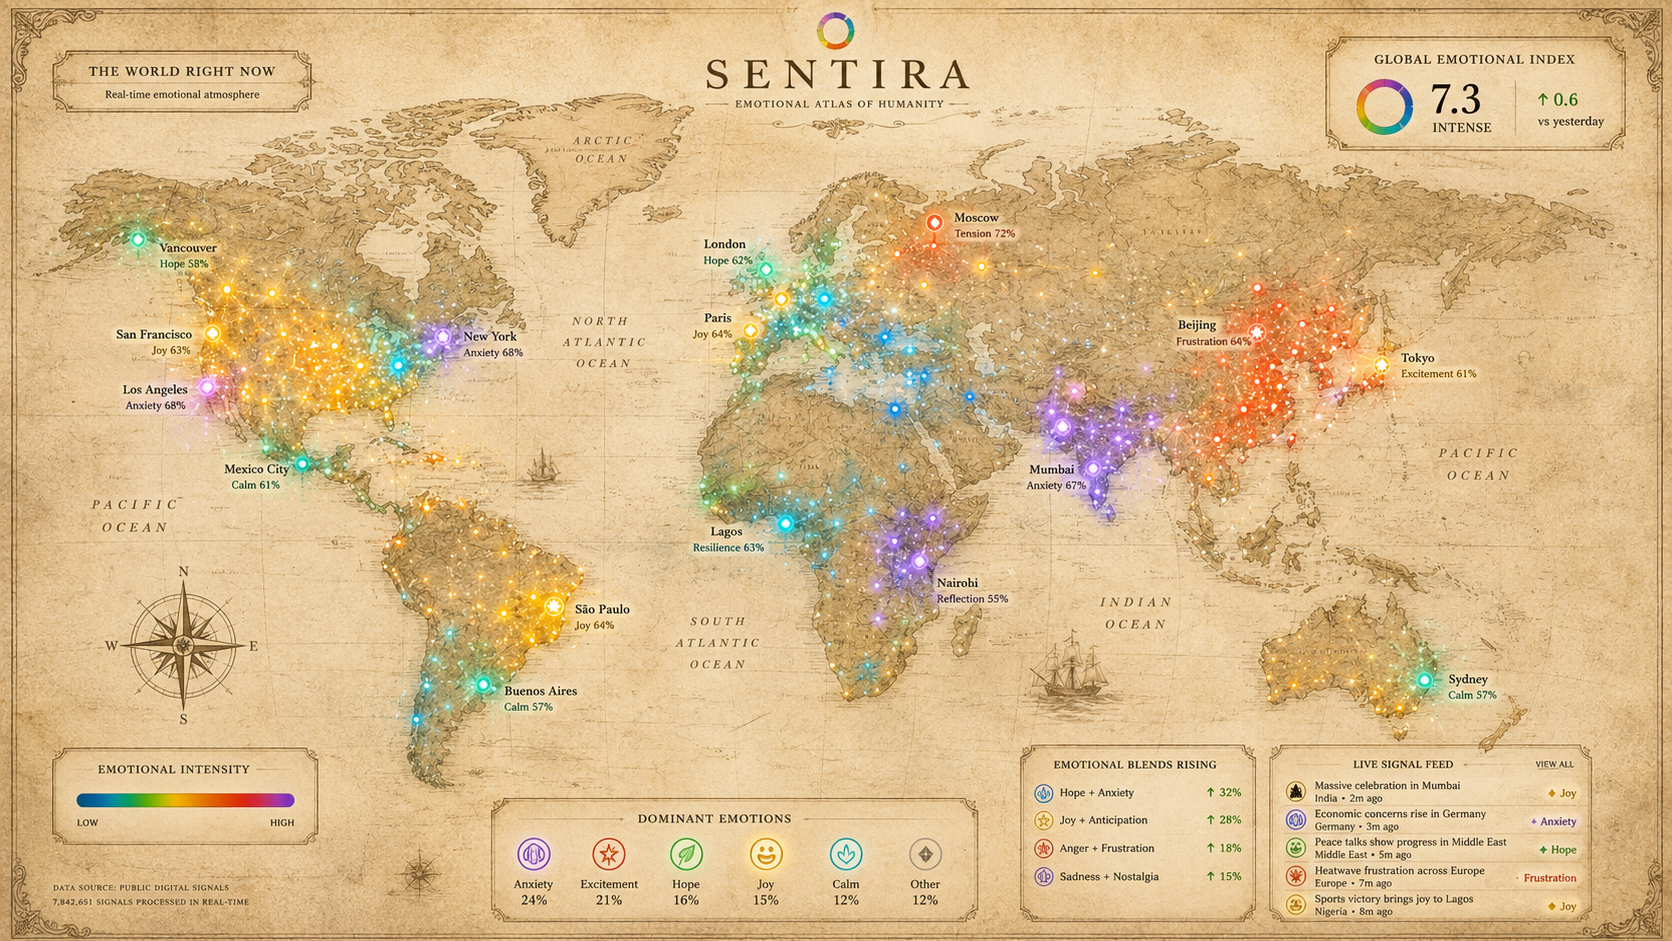
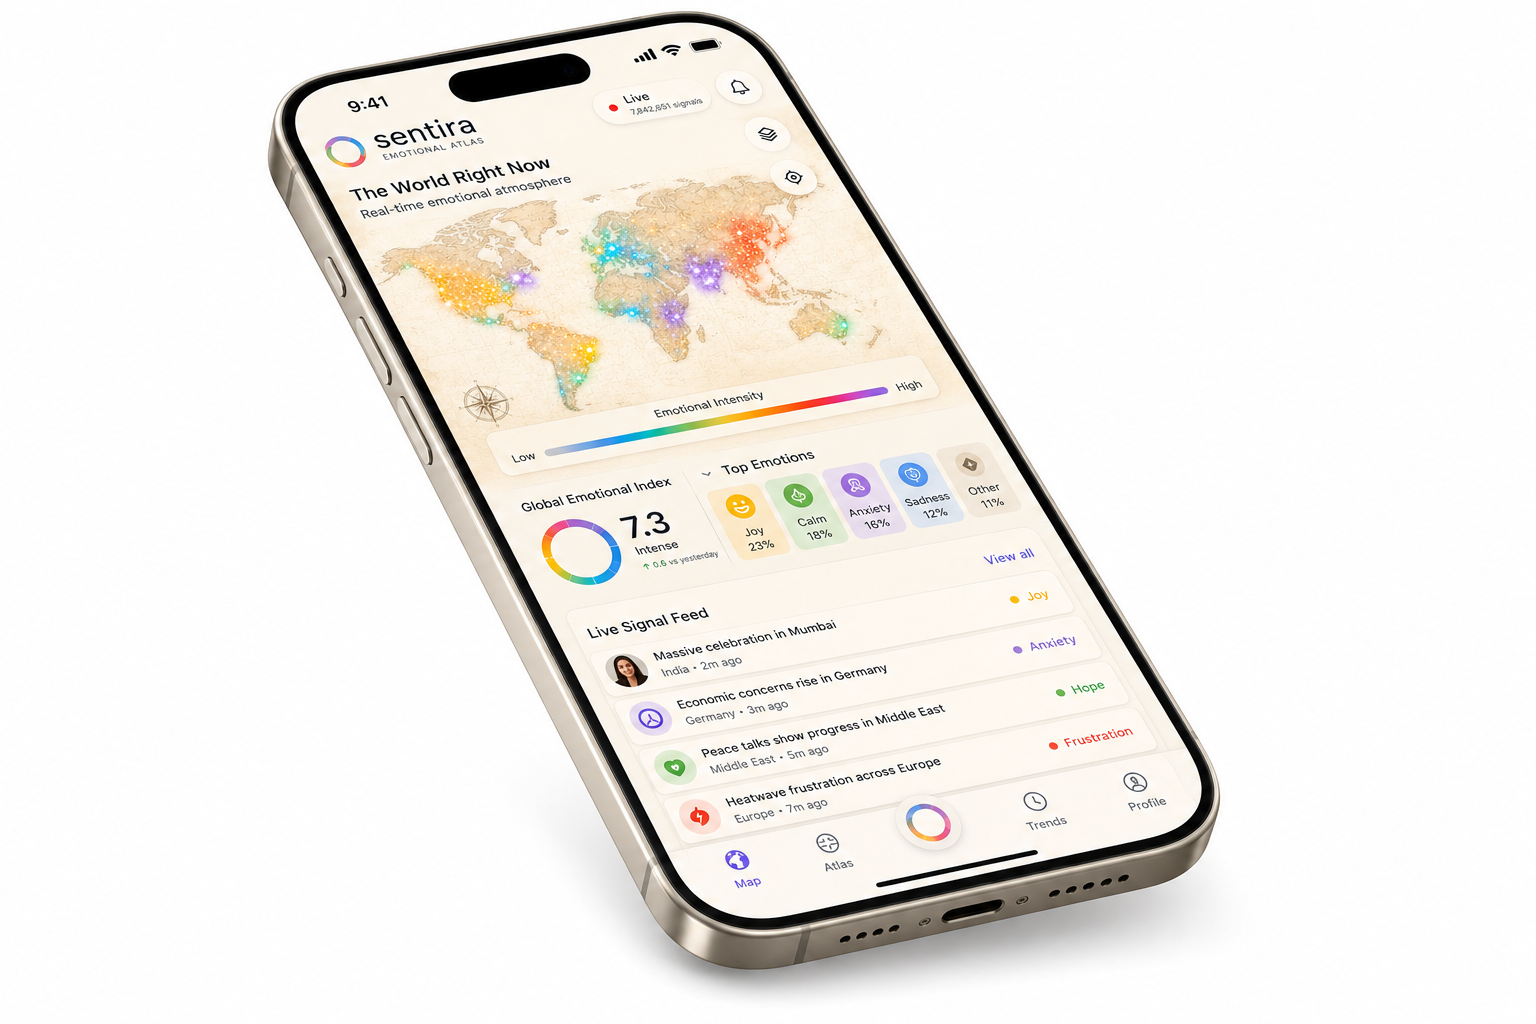
The world has feelings.
Divergent feelings.
Not what the world feels. How differently it feels.
82
Emotions
Global
Coverage
15m
Updates
Open Web
Only
DEMOThis is an interactive demo of the Sentira™ pulse check. Colors are illustrative — real-time AI classification launches with the full platform.
Coming Soon
Want your full Sentira™ emotion check-in?
Personal emotion history · Your Emotion Fingerprint · City comparison · $7–12/mo
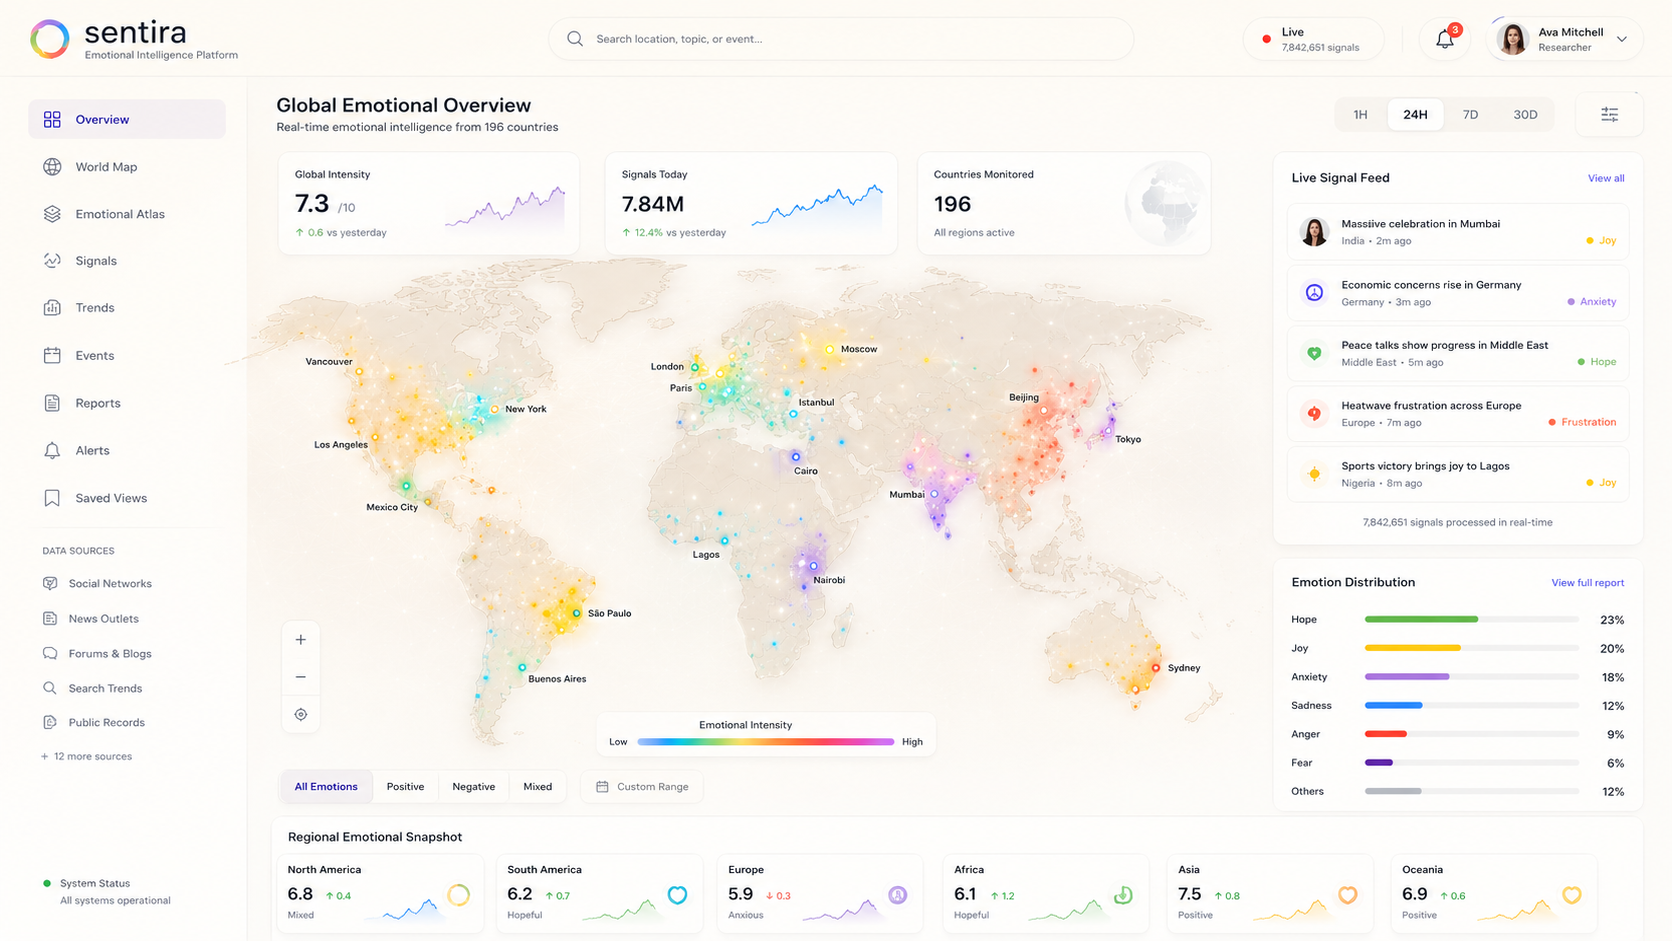
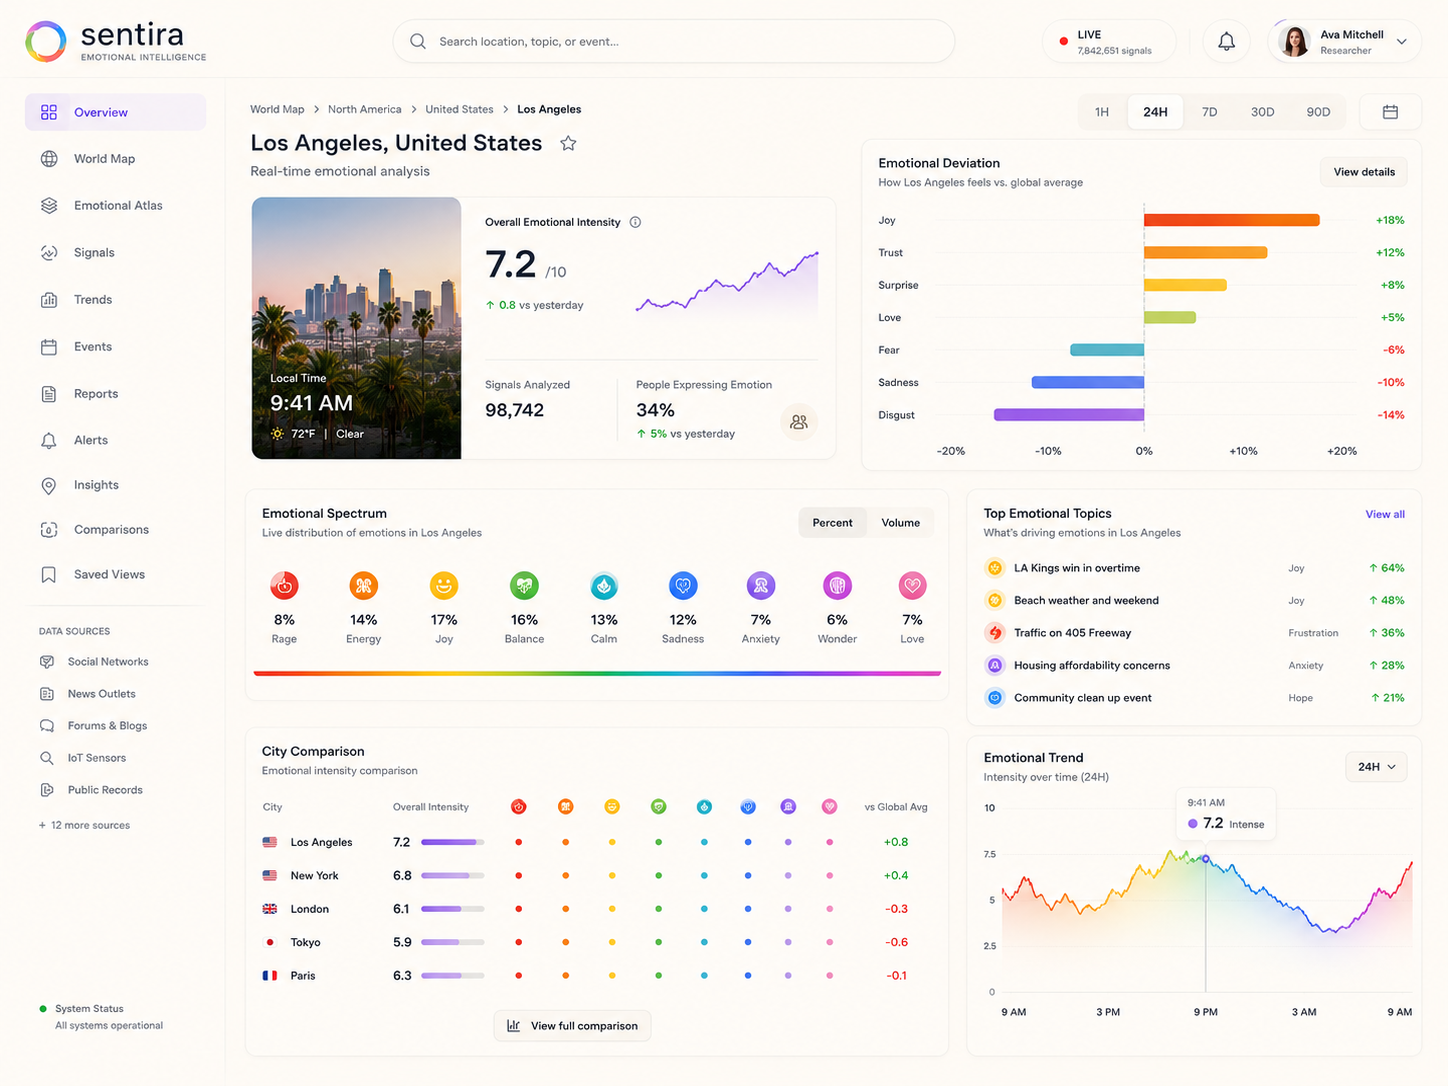
The Platform
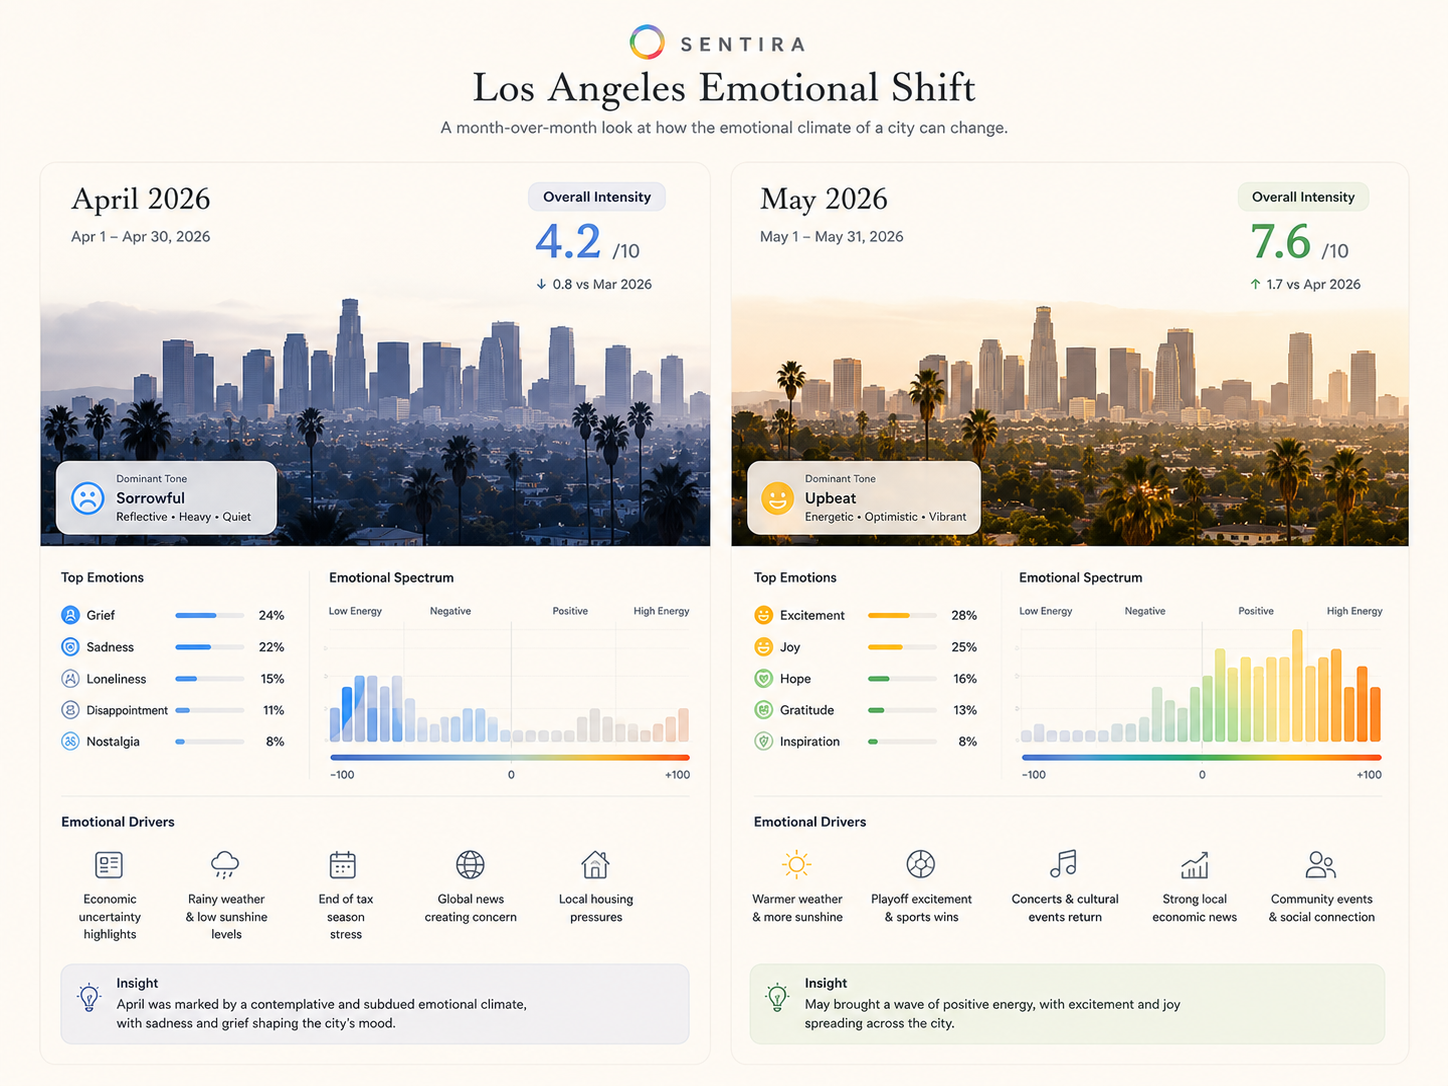
Deviation intelligence, visualized.
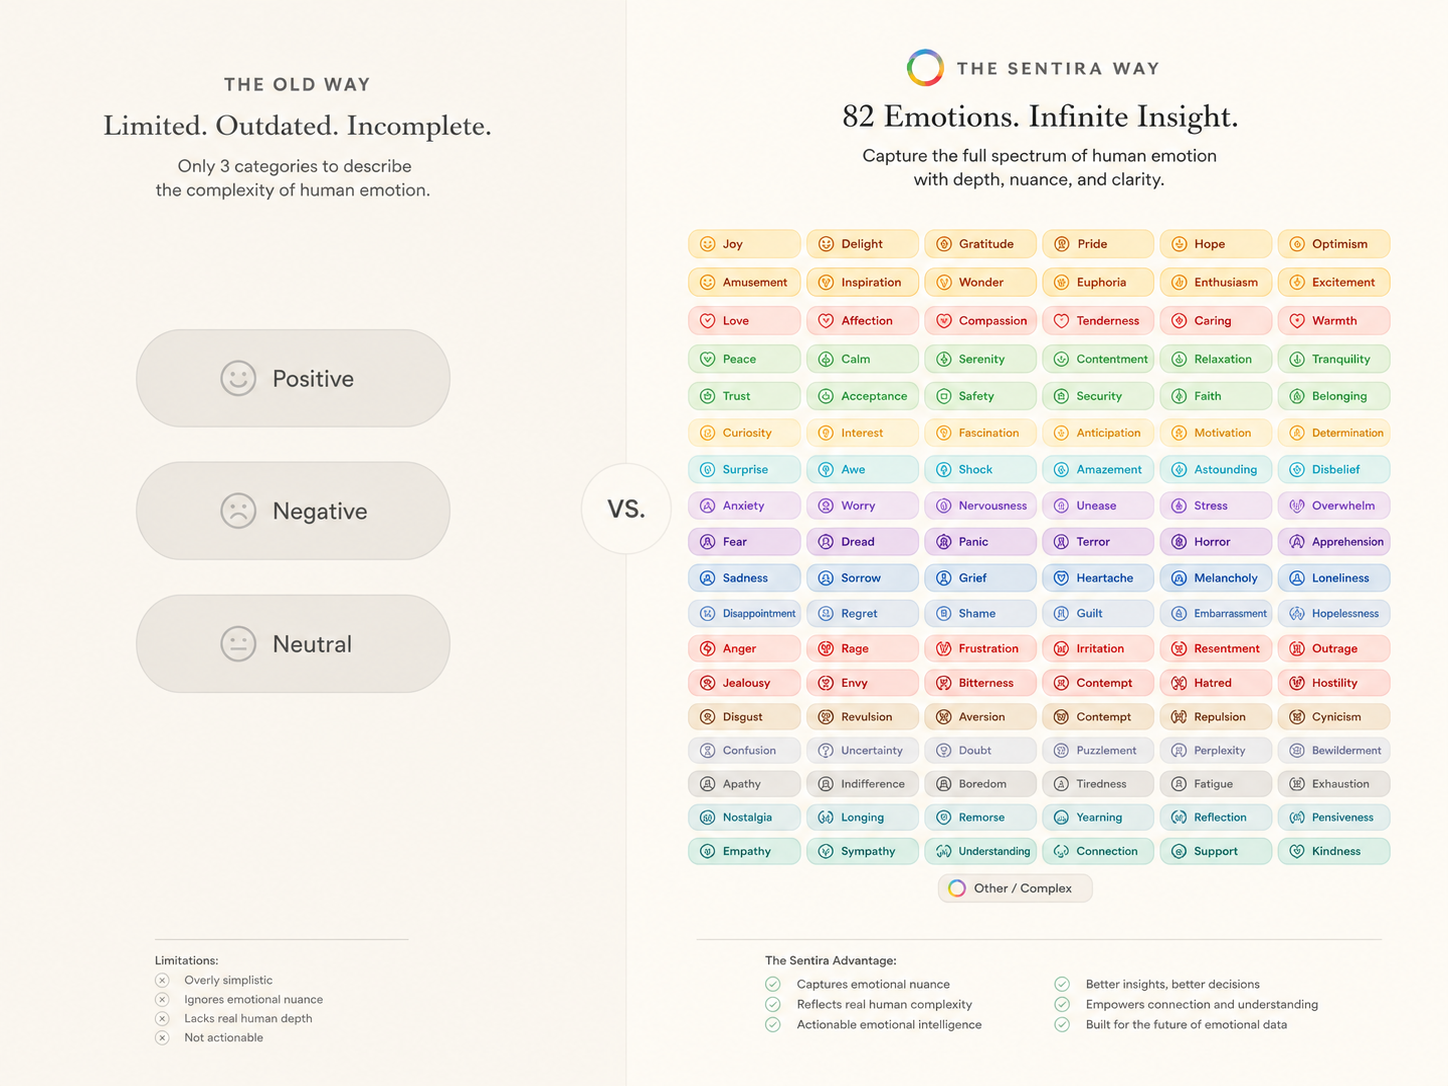
The Emotion System
82 emotions. 12 families. One spectrum.
Lighter shade = gentler emotion · Darker shade = more intense
Joy
HappinessDelightElationEuphoriaContentmentAmusementEnthusiasmBlissSerenityGratitudeOptimism
Love
AffectionTendernessCompassionAdorationWarmthLongingDevotionInfatuationEmpathySentimentality
Excitement
AnticipationEagernessThrillExhilarationCuriosityWonderFascinationInspirationZeal
Calm
TranquilityPeaceRelaxationEquanimityMindfulnessStillnessComfortEaseAcceptance
Sadness
GriefSorrowMelancholyDespairLonelinessRegretDisappointmentHeartacheNostalgiaHopelessness
Anxiety
WorryNervousnessDreadApprehensionUneasePanicTensionRestlessnessHypervigilance
Anger
FrustrationIrritationRageResentmentContemptIndignationHostilityBitternessExasperation
Disgust
RevulsionDistasteRepugnanceAversionLoathingDiscomfort
Shame
EmbarrassmentGuiltHumiliationRemorseRegretSelf-reproachMortification
Pride
ConfidenceAchievementDignitySelf-respectHonorTriumphFulfillment
Confusion
BewildermentUncertaintyDisorientationAmbivalenceDoubtPerplexityIndecision
Apathy
DetachmentIndifferenceNumbnessDisengagementBoredomResignationListlessness
Methodology
Five layers. One truth.
— Sentira™
00
Declare
You submit how you feel directly via the pulse check. Anonymous. No account needed. Your signal joins the live atlas.
01
Harvest
Sentira ingests tens of thousands of open web signals every 15 minutes from GDELT 2.0 and global news APIs.
02
Classify
Each signal is assigned one of 82 named emotions and a topic — disaster, politics, economy, sports, culture, crime.
03
Normalize
The key innovation. Every emotion is measured against the topic-specific city baseline to produce a deviation score.
04
Visualize
Deviation scores render onto the live ROYGBIV world atlas with city drilldowns, timelines, and API access.
Use Cases
Who buys deviation intelligence.
📡
News Intelligence
"We track civic emotional response to breaking events before editorial consensus forms."
Detect how cities emotionally diverge from global baseline the moment a story breaks. Move faster than the narrative.
📈
Financial Intelligence
"Pre-market emotional deviation signals that no traditional data provider offers."
City-level emotional deviation indexed against economic events. An independent signal for quantitative models.
🏛️
Institutional Research
"Longitudinal emotional data normalized by topic — a new lens on collective human response."
Academic-grade methodology with full audit trail. Topic-normalized baselines. Deviation scoring. City fingerprints.
🎯
Campaign Intelligence
"We time campaign activation against city emotional baselines, not gut instinct."
Know when a city is emotionally receptive before you spend. Sponsored pulse checks. Brand sentiment deviation.
Request a demonstration
API access · Custom data packages · Enterprise pricing
hello@sentira.net →